
 Gerardo Marx Chávez-Campos
2a70301f61
Gerardo Marx Chávez-Campos
2a70301f61
|
5 years ago | |
|---|---|---|
| 1_basics | 5 years ago | |
| 3_equ-tab-figs | 5 years ago | |
| 4_pgfplots | 5 years ago | |
| beamer | 5 years ago | |
| flyer | 5 years ago | |
| .gitignore | 5 years ago | |
| Readme.md | 5 years ago | |
| webinar.org | 5 years ago | |
Readme.md
How to Write your Next Thesis in LaTeX
An International Webinar between Instituto Tecnológico de Morelia, Jade University of Applied Science and Óbuda University
Repository organization
The repository is organized in the next way. The 1_basics folder includes information (presentations or guides), examples source code, and any other useful information that the attendant can review during or after the webinar.
Webinar Contents
Here you can find the highlights of each day lecture, to avoid repetitive points during the webinar.
Day 1: Introduction (Marx)
- What is LaTeX?
- How LaTeX works?
- Exploring Overleaf (Windows, organization, files)
- Compiling a basic document
- Using basic commands and definitions
- document options and geometry
- Defining new vars, paragraph spaces, tabulation space, and text sizes
- A dummy text definition command
- The minipage challenge
Here are some basic but useful information about the eexamples and packages that we use during the webinar. If you require more deep information you can visit the links provided along the Readme file.
Example 1: Hello LaTeX
A basic example to test any LaTeX distribution is:
\documentclass{standalone}
\begin{document}
Hello \LaTeX{}
\end{document}
Example 2: Fonts and Styles
Latex Font Formats
Font formats, like bold or italics, are useful for highlight important text section by taking the reader's attention. Next are listed the most common used formats; if you need a detailed manual please look the LaTeX2e font selection manual.
| Code | Notes |
|---|---|
\textbf{} |
for bold text |
\textmd{} |
for medium |
\textit{} |
for italics |
\textsl{} |
for slanted |
\underline{} |
for underline |
\textsc{} |
for small capital letters |
\uppercase{} |
for large capital letters |
\textsuperscript{} |
for raised text |
\textsubscript{} |
for lowered text |
\texttt{} |
for terminal text |
\oldstylenums{} |
for old number font |
Font sizes
The font formats and sizes are not modified frequently, most of the time LaTeX makes a good work with them. However, here are some common font size modifiers to work with:
| Class option | 10pt | 11pt | 12pt |
|---|---|---|---|
| \Huge | 25pt | 25pt | 25pt |
| \huge | 20pt | 20pt | 25pt |
| \LARGE | 17pt | 17pt | 20pt |
| \Large | 14pt | 14pt | 17pt |
| \large | 12pt | 12pt | 14pt |
| \normalsize(default) | 10pt | 11pt | 12pt |
| \small | 9pt | 10pt | 11pt |
| \footnotesize | 8pt | 9pt | 10pt |
| \scriptsize | 7pt | 8pt | 8pt |
| \tiny | 5pt | 6pt | 6pt |
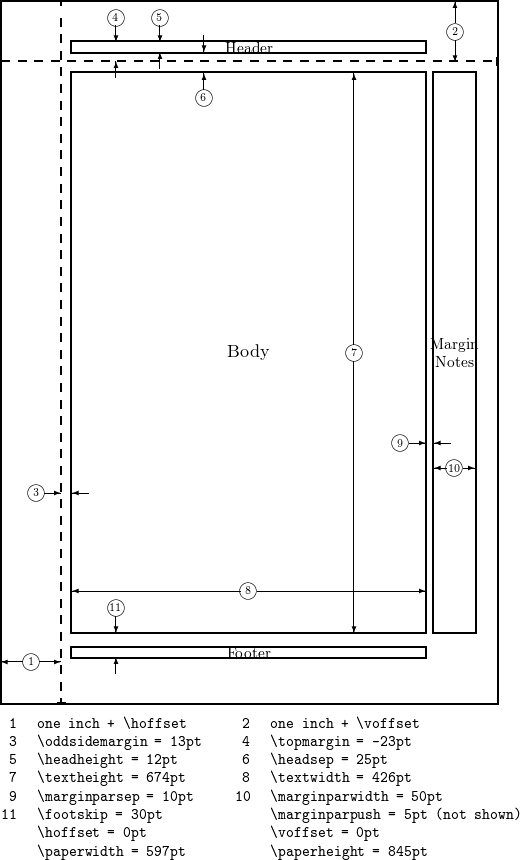
Example 3: Geometry and Lengths
Geometry package
The documents geometry can be handle by natural LaTeX commands. Howeever, there is a useful package to make it easier. The package is Geometry.
Units
The next table list the valid units used on LaTeX 1.
| Abbreviation | Value |
|---|---|
pt |
a point is approximately 1/72.27 inch, that means about 0.0138 inch or 0.3515 mm (exactly point is defined as 1/864 of American printer’s foot that is 249/250 of English foot) |
mm |
a millimeter |
cm |
a centimeter |
in |
inch |
ex |
roughly the height of an 'x' (lowercase) in the current font (it depends on the font used) |
em |
roughly the width of an 'M' (uppercase) in the current font (it depends on the font used) |
mu |
math unit equal to 1/18 em, where em is taken from the math symbols family |
Day 2: Document Classes and Sectional Units
Day 3: Equations, Tables and Figures (Marx)
- Inline equations
- Equation's environment
- Cross-references with
\ref amsmathpackage- The equation challenge
- The Matrix challenge
- Tables and
booktabspackage - The
graphicxpackage and short titles - Subfigures challenge
- Table of Contents
- Changing the way it looks
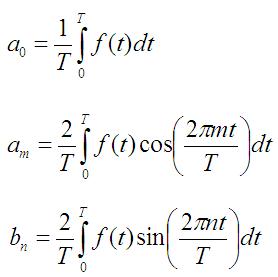
The equation challenge
First the Fourier series coefficients:
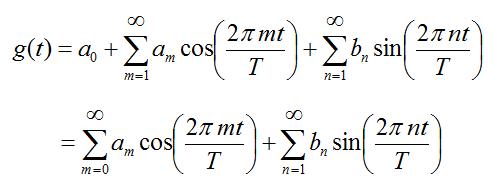
Then, the complete Equation:
If you need an extended manual please take a look to the short math guide.
Matrices
By using the amsmath package it is possible to write easily matrices by:
\begin{bmatrix}
  1 & 2 & 3\\
  a & b & c
\end{bmatrix}
you also use pmatrix, Bmatrix , vmatrix, and Vmatrix.
Subfigures
%preamble
\usepackage{caption}
\usepackage{subcaption}
.....
%on body
\begin{figure}
   \centering
   \begin{subfigure}[b]{0.3\textwidth}
       \centering
       \includegraphics[width=\textwidth]{graph1}
       \caption{$y=x$}
       \label{fig:y equals x}
   \end{subfigure}
   \hfill
   \begin{subfigure}[b]{0.3\textwidth}
       \centering
       \includegraphics[width=\textwidth]{graph2}
       \caption{$y=3sinx$}
       \label{fig:three sin x}
   \end{subfigure}
   \hfill
   \begin{subfigure}[b]{0.3\textwidth}
       \centering
       \includegraphics[width=\textwidth]{graph3}
       \caption{$y=5/x$}
       \label{fig:five over x}
   \end{subfigure}
      \caption{Three simple graphs}
      \label{fig:three graphs}
\end{figure}
Subtables
\begin{table}[h]
  \begin{subtable}[h]{0.45\textwidth}
      \centering
      \begin{tabular}{l | l | l}
      Day & Max Temp & Min Temp \\
      \hline \hline
      Mon & 20 & 13\\
      Tue & 22 & 14\\
      Wed & 23 & 12\\
      Thurs & 25 & 13\\
      Fri & 18 & 7\\
      Sat & 15 & 13\\
      Sun & 20 & 13
     \end{tabular}
     \caption{First Week}
     \label{tab:week1}
  \end{subtable}
  \hfill
  \begin{subtable}[h]{0.45\textwidth}
      \centering
      \begin{tabular}{l | l | l}
      Day & Max Temp & Min Temp \\
      \hline \hline
      Mon & 17 & 11\\
      Tue & 16 & 10\\
      Wed & 14 & 8\\
      Thurs & 12 & 5\\
      Fri & 15 & 7\\
      Sat & 16 & 12\\
      Sun & 15 & 9
      \end{tabular}
      \caption{Second Week}
      \label{tab:week2}
   \end{subtable}
   \caption{Max and min temps recorded in the first two weeks of July}
   \label{tab:temps}
\end{table}
Day 4: Plots with PGFPlots package(Marx)
- Making plots from equation
- Plotting data from a simple experiment
- Title, labels, and ticks configuration
- Multi-trace plots and its configuration
- Bar and scatter plots
- Reading data from a
CSVfiles
Day 5: References with Bibtex (Kai)
What is a reference? What is a good reference?
- A simple reference Workflow with BibTEX
- Citation Styles
- Workflow Improvements
- Tools
- BibTEX
- JabRef
- Citavi
- Zotero
Certficates Feedback session