|
|
- # How to Write your Next Thesis in LaTeX #
-
- *An International Webinar between Instituto Tecnológico de Morelia, Jade University of Applied Science and Óbuda University*
-
- ## Repository organization
- The repository is organized in the next way. The `1_basics` folder includes information (presentations or guides), examples source code, and any other useful information that the attendant can review during or after the webinar.
-
- ## Webinar Contents ##
- Here you can find the highlights of each day lecture, to avoid repetitive points during the webinar.
-
- -------
-
- ### Day 1: Introduction (Marx)
- * What is LaTeX?
- * How LaTeX works?
- * Exploring Overleaf (Windows, organization, files)
- * Compiling a basic document
- * Using basic commands and definitions
- * document options and geometry
- * Defining new vars, paragraph spaces, tabulation space, and text sizes
- * A dummy text definition command
-
-
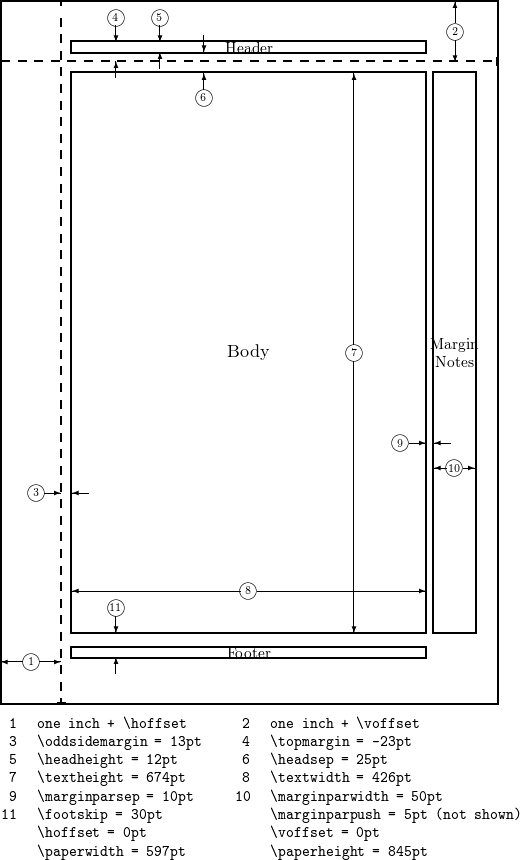
- #### Geometry and Lengths
-
- ##### Geometry package
-
- 
-
- ##### Units
- The next table list the valid units used on LaTeX [^1].
- | Abbreviation | Value |
- |--------------|--------|
- | `pt` | a point is approximately 1/72.27 inch, that means about 0.0138 inch or 0.3515 mm (exactly point is defined as 1/864 of American printer’s foot that is 249/250 of English foot)|
- |`mm`| a millimeter|
- |`cm`| a centimeter|
- |`in`| inch|
- |`ex` |roughly the height of an 'x' (lowercase) in the current font (it depends on the font used)|
- |`em` |roughly the width of an 'M' (uppercase) in the current font (it depends on the font used)|
- |`mu` |math unit equal to 1/18 em, where em is taken from the math symbols family|
- [^1]: Extracted from [Overleaf](https://www.overleaf.com/learn/latex/Lengths_in_LaTeX)
-
- ----
-
- ### Day 2: Document Classes and Sectional Units ###
- ### Day 3: Equations, Tables and Figures (Marx) ###
- ### Day 4: Plots with PGFPlots package(Marx) ###
- * Making plots from equation
- * Plotting data from a simple experiment
- * Title, labels, and ticks configuration
- * Multi-trace plots and its configuration
- * Bar and scatter plots
- * Reading data from a `CSV` files
- ### Day 5: References with Bibtex ###
-
|
