|
|
2 years ago | |
|---|---|---|
| Readme.md | 2 years ago | |
| Sample CSV format.csv | 2 years ago | |
| csv2kml.py | 2 years ago | |
| kmlexample.png | 2 years ago | |
Readme.md
csv2kml
This repository provides a .py code to convert a .csv database to a .kml archive, used to store markers for Google Earth and Google Maps. In this document, it's explained how to use it and how it works, in order to help users modify it for future projects.
This code is based on the Sample CSV format.csv file in this repository, and works for that structure. It can be modified to make it usable for other data.
Requirements
To be able to run this code it is important to install the modules: csv and simplekml. Using:
pip install python-csv
pip install simplekml
Code
Reading csv file
The function open is used to open any type of file, it's important to provide its path and open it in read mode using encoding UTF-8, the name of the variable where the stream is saved is file, however it can be named differently. Next, this variable can be passed to the csv reader using its reader function. The header can be extracted by executing csv next function. All of this is done in the following lines:
with open(r'D:\aleja\Downloads\cosa\Pozos OOAPAS_1.csv', 'r', encoding='UTF-8') as file:
    reader = csv.reader(file)
    headers = next(reader)
Now, it's necessary to create a kml object where the data is going to be stored before creating the output file, that is:
kml = simplekml.Kml()
Once that is done, it's possible to extract data from the rest of the rows and start building strings keeping in mind that rows from a csv file work as if they were arrays. In this case, according to the information retrieved, this process is done with the following code:
    # Iterate over the rows in the CSV file
    for row in reader:
        # Extract the data for each field in the row
        name = row[1]
        pressure = "Sensor de presion: " + row[2] + "  |  "  + row[3]
        starter = "Arrancador: " + row[4] + "  |  "  + row[5]
        flow = "Caudalimetro: " + row[6] + "  |  "  + row[7]
        power = "Analizador de potencia: " + row[8] + "  |  "  + row[9]
        switch = "Interruptor de presion: " + row[10] + "  |  " + row[11]
        rtu = "RTU: " + row[12] + "  |  "  + row[13]
        modem = "Modem: " + row[14] + "  |  "  + row[15]
        ID = "ID: " + row[18]
        level = "Sensor de nivel: " + row[19] + "  |  " + row[20]

        latitude = float(row[17])
        longitude = float(row[16])
Marker description box
We want this information to be displayed in an description box of the marker. To achieve that, a function with an undefined number of arguments is used, which takes any number of strings and concatenate them adding a
between them, to display them in different lines each.
def description(*argv):
    """Creates a description block with the arguments of the function"""

    block = ''
    check = 0
    for arg in argv:
        if arg == argv[0] and check == 0:
            block = block + arg
            check = 1
        else:
            block = block + '<BR>' + arg

    return block
When calling this function with the data read from the csv, we get:
datos = description(name, ID, pressure, starter, flow, power, switch, rtu, modem, level)
Creating a new point in kml
Finally, we create a new point in the kml where the name is the string that will appear next to the marker in the map, description is the information to place in the description box, and coords are the coordinates where the marker will be placed. The size of the marker can be defined with scale and the icon to show can be different, choosing it from Google's website.
        point = kml.newpoint(name=name, description=datos, coords=[(longitude, latitude)])
        point.style.labelstyle.scale = 1
        point.style.iconstyle.icon.href = 'http://maps.google.com/mapfiles/kml/shapes/water.png'
Considering the following input:
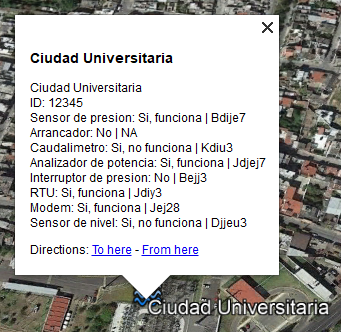
14/2/2023 9:41:44,Ciudad Universitaria ,"Si, funciona",Bdije7,No,NA,"Si, no funciona",Kdiu3,"Si, funciona",Jdjej7,No,Bejj3,"Si, funciona",Jdiy3,"Si, funciona",Jej28,-101.18628,19.72459,12345,"Si, no funciona",Djjeu3
The result of this process once the kml is created is the one shown in the following picture.
Saving file
To print the file, we can use:
print(kml.kml())
And to save it we use kml save method, including the path where it is desired to store the file.
kml.save(r'D:\aleja\Downloads\cosa\Pozos OOAPAS_1.kml')
